![]()

Space Art
Galleries
Wallpaper
Star Trek
Computer Science
AI
NN.MDB
Free VB Code
Science Fiction
Stories
Free 3D Models
Ben's Scale Models
of Planetary Systems
|
Directional Movement Indicators using n Range
Introduction to the Theory
The length of that period, mathematically referred to as “n days,” is critical. Shorter periods produce more erratic results, generating more trading signals and as a result more false signals. Longer periods produce smoother results, generating fewer (and truer) signals, but also as a result of the longer period, generating those signals later, often well after the trend has ended. Mathematicians argue about the correct value of n, with most agreeing it is 9, 14 days or somewhere thereabouts. This researcher had been working on the theory that the correct value of n may differ from security to security, from strategy to strategy and even perhaps, from day to day and was attempting to devise a computer program that would seek out a given stock’s “best value of n.” That goal proved illusive, however, during experimentation it was noted that while differing values of n could produce wildly different signals from the same stock on the same day, there were also days in which all values of n produced the same signal for that stock. And those signals appeared to be the truest ones of all.
|
||
|
A new theory was formed: A new chart was plotted that demonstrates this theory.
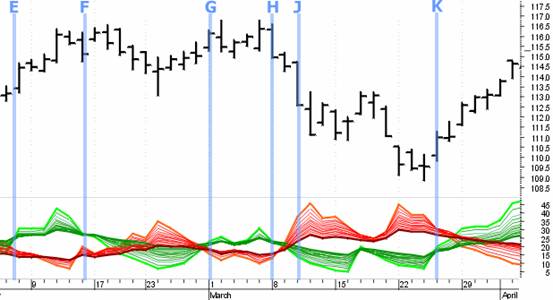
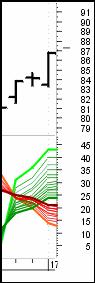
We overlaid 15 different DI Movement charts with varying
values of n, combining thirty different indicators in to one. Our
Experiments were based on the nRange of 5 to 20 days. The rest of this
document will focus on that chart and this researcher’s attempt to interpret
it.
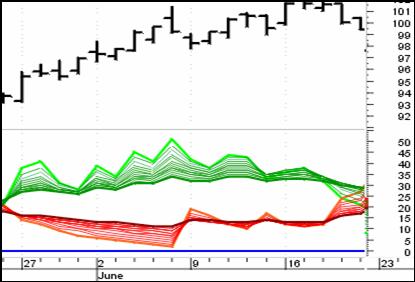
Trending Positive All DI+ (green lines) are well above DI- (red) with a large open white space between. This is the result of sustained up trend.
|
||
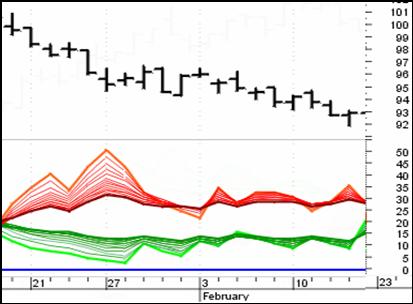 Trending Negative
All DI- (red lines) are well above DI+ (green) with a large open white space between. This is the result of sustained downward trend. |
||
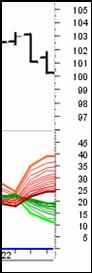
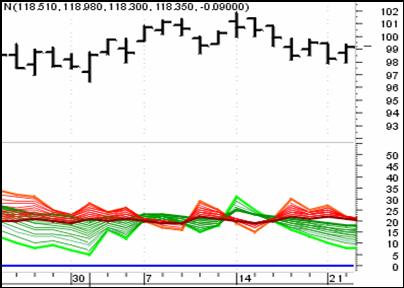 Entanglement DI- (red lines) crisscross with DI+ (green) with no (or very little) open white space between. Different values of n are providing conflicting buy and sell signals.
This is the result of mostly sideways price movement, with no clear trend. |
||
|
Having identified our three basic states, the goal of the system we are to create is obvious; To open a position at the beginning of a trend, to close that position as close to the end of that trend as possible, and to not trade at all during periods of entanglement. The obvious set of opening signals for that system is as follows. |
||
 OPEN LONG SIGNAL
Description:
Cause:
Signal: |
||
|
OPEN SHORT SIGNAL
Description:
Cause:
Signal: |
||
|
The open signals were obvious
enough. It was the attempt to generate closing signals that proved problematic.
If one simply waits for an "Open Short" signal to close a long position, then
your trend is already well reversed and chances are that your profit is gone.
However, if one tries to predict the end of the trend, by closing the position
as soon as one sees Entanglement, then, about half the time, the trend continued
anyway and you still lose money. We ended up with over a dozen different ways to generate closing signals, all of which had these same problems to one extent or another. It was at that point that we decided to employ a pattern recognition system (i.e. a neural network) to take a better look at Directional Movement. That work is summarized in my next white paper: An Analysis of Directional Movement as a Complex System. |