
Space Art
Galleries
Wallpaper
Star Trek
Computer Science
AI
NN.MDB
Free VB Code
Science Fiction
Stories
Free 3D Models
Ben's Scale Models
of Planetary Systems
www.BenMargolis.com/compsci
 New
Feature:
New
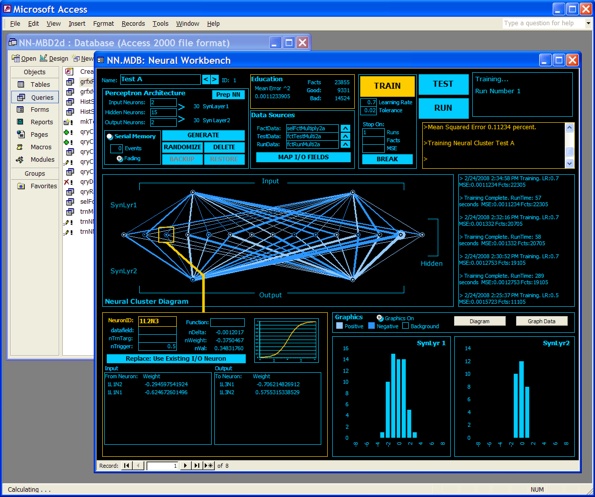
Feature:NN.MDB
The Database that Thinks
This is, I believe, the world's only Neural Network Simulator
native to Microsoft Access.
It is a fully functional three-layer perceptron comprised entirely of VBA subs and functions, Access tables and SQL queries.
Status: (Updated 2/2008)
Works, learns, proven. Training is a little slow (okay, very slow).
Interface, testing and data I/O could be more "robust." Several things still
NYI, and I have now taken the entire project in
a new direction for my own NN experimentation. (see:
Version 3)
|
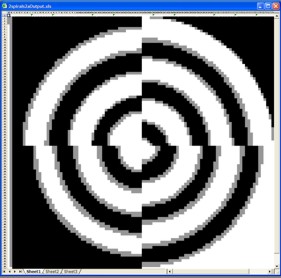
The Two Spirals Problem Solved
|
Directional Movement Indicators using n
Range
Directional Movement Indicators (DI+ and DI-) have long been established as
an effective means of determining whether the price change of a given
security is trending in one direction or another. These indicators are
created by summing up the intraday movement of a stock across a period of
several days.
|
|
|
A typical DI Movement
chart
with a 14 day period. Note that |
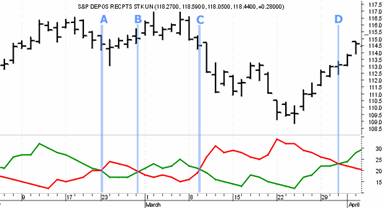
The length of that period, mathematically referred to as “n days,” is critical. Shorter periods produce more erratic results, generating more trading signals and as a result more false signals. Longer periods produce smoother results, generating fewer (and truer) signals, but also as a result of the longer period, generating those signals later, often well after the trend has ended. Mathematicians argue about the correct value of n, with most agreeing it is 9, 14 days or somewhere thereabouts.
This researcher had been working on the theory that the correct value of n may differ from security to security, from strategy to strategy and even perhaps, from day to day and was attempting to devise a computer program that would seek out a given stock’s “best value of n.”
That goal proved illusive, however, during experimentation it was noted that while differing values of n could produce wildly different signals from the same stock on the same day, there were also days in which all values of n produced the same signal for that stock. And those signals appeared to be the truest ones of all.
READ MORE >>An Analysis of Directional Movement as a Complex System
Continuing on my work in the recent white paper, Directional Movement Indicators using n Range, this researcher was trying to use DM to generate earlier and more reliable trading signals.
Directional Movement (DM) Indicators have long been established as an effective method of identifying and measuring trends in the stock market. We had discovered that using a range of n values, we could generate much earlier and better signals than we could with any particular value of n. We also discovered that with minor variations in the parameters of our signal-generator we could make these signals happen earlier and earlier, even to the point of being able to predate (or perhaps predict) a trend by two or three days. Unfortunately, while we could create almost any set of signals we wanted in a given period, elsewhere in that dataset, we were generating other signals that were not as good, and many that were downright wrong.
Specifically, it was the closing signals that proved the most difficult to generate accurately. Any time is a good time to get into a trend, getting out before the trend reverses and you lose your profit is problematic. And so we had at last discovered what seemed to be brick wall; a direct, inverse relationship between how early a signal was generated and how reliable it was.
|
|